

Prometheus监控告警系统
什么是prometheus
Prometheus是由SoundCloud开发的开源监控报警系统和时序列数据库(TSDB)。Prometheus使用Go语言开发,是Google BorgMon监控系统的开源版本。
2016年由Google发起Linux基金会旗下的原生云基金会(Cloud Native Computing Foundation), 将Prometheus纳入其下第二大开源项目。
Prometheus目前在开源社区相当活跃。
Prometheus和Heapster(Heapster是K8S的一个子项目,用于获取集群的性能数据。)相比功能更完善、更全面。Prometheus性能也足够支撑上万台规模的集群。
prometheus的特点
多维度数据模型。
灵活的查询语言。
不依赖分布式存储,单个服务器节点是自主的。
通过基于HTTP的pull方式采集时序数据。
可以通过中间网关进行时序列数据推送。
通过服务发现或者静态配置来发现目标服务对象。
支持多种多样的图表和界面展示,比如Grafana等。
基本原理
Prometheus的基本原理是通过HTTP协议周期性抓取被监控组件的状态,任意组件只要提供对应的HTTP接口就可以接入监控。不需要任何SDK或者其他的集成过程。这样做非常适合做虚拟化环境监控系统,比如VM、Docker、Kubernetes等。输出被监控组件信息的HTTP接口被叫做exporter 。目前互联网公司常用的组件大部分都有exporter可以直接使用,比如Varnish、Haproxy、Nginx、MySQL、Linux系统信息(包括磁盘、内存、CPU、网络等等)。
服务过程
Prometheus Daemon负责定时去目标上抓取metrics(指标)数据,每个抓取目标需要暴露一个http服务的接口给它定时抓取。Prometheus支持通过配置文件、文本文件、Zookeeper、Consul、DNS SRV Lookup等方式指定抓取目标。Prometheus采用PULL的方式进行监控,即服务器可以直接通过目标PULL数据或者间接地通过中间网关来Push数据。
Prometheus在本地存储抓取的所有数据,并通过一定规则进行清理和整理数据,并把得到的结果存储到新的时间序列中。
Prometheus通过PromQL和其他API可视化地展示收集的数据。Prometheus支持很多方式的图表可视化,例如Grafana、自带的Promdash以及自身提供的模版引擎等等。Prometheus还提供HTTP API的查询方式,自定义所需要的输出。
PushGateway支持Client主动推送metrics到PushGateway,而Prometheus只是定时去Gateway上抓取数据。
Alertmanager是独立于Prometheus的一个组件,可以支持Prometheus的查询语句,提供十分灵活的报警方式。
docker-stack 配置服务
version: '3.7'

volumes:
    prometheus_data: {}
    grafana_data: {}

networks:
  monitor-net:

services:
  webhook-dingding:
    image: timonwong/prometheus-webhook-dingtalk
    command:
      - '--web.enable-ui'
      - '--config.file=/etc/prometheus-webhook-dingtalk/config.yml'
    volumes:
      - ./webhook/config.yml:/etc/prometheus-webhook-dingtalk/config.yml
    ports:
      - 8060:8060
    networks:
      - monitor-net
    restart: always
    deploy:
      mode: global
      restart_policy:
          condition: any

  prometheus:
    image: prom/prometheus
    volumes:
      - ./prometheus/:/etc/prometheus/
      - prometheus_data:/prometheus
    command:
      - '--config.file=/etc/prometheus/prometheus.yml'
      - '--storage.tsdb.path=/prometheus'
      - '--web.console.libraries=/usr/share/prometheus/console_libraries'
      - '--web.console.templates=/usr/share/prometheus/consoles'
    ports:
      - 9090:9090
    depends_on:
      - cadvisor
    networks:
      - monitor-net
    deploy:
      placement:
        constraints:
          - node.role==manager
      restart_policy:
        condition: any

  node-exporter:
    image: prom/node-exporter
    volumes:
      - /proc:/host/proc:ro
      - /sys:/host/sys:ro
      - /:/rootfs:ro
    command:
      - '--path.procfs=/host/proc'
      - '--path.sysfs=/host/sys'
      - --collector.filesystem.ignored-mount-points
      - "^/(sys|proc|dev|host|etc|rootfs/var/lib/docker/containers|rootfs/var/lib/docker/overlay2|rootfs/run/docker/netns|rootfs/var/lib/docker/aufs)($$|/)"
    ports:
      - 9100:9100
    networks:
      - monitor-net
    deploy:
      mode: global
      restart_policy:
          condition: any

  kafka-exporter:
    image: danielqsj/kafka-exporter
    command:
      - '--kafka.server=172.31.0.117:9092'
      - '--kafka.server=172.31.0.117:9093'
    ports:
      - 9308:9308
    networks:
      - monitor-net
    restart: always
    deploy:
      mode: global
      restart_policy:
          condition: any

  alertmanager:
    image: prom/alertmanager
    ports:
      - 9093:9093
    volumes:
      - "./alertmanager/:/etc/alertmanager/"
    networks:
      - monitor-net
    command:
      - '--config.file=/etc/alertmanager/config.yml'
      - '--storage.path=/alertmanager'
    deploy:
      placement:
        constraints:
           - node.role==manager
      restart_policy:
        condition: any

  cadvisor:
    image: google/cadvisor
    volumes:
      - /:/rootfs:ro
      - /var/run:/var/run:rw
      - /sys:/sys:ro
      - /var/lib/docker/:/var/lib/docker:ro
    ports:
      - 8080:8080
    networks:
      - monitor-net
    deploy:
      mode: global
      restart_policy:
          condition: any

  grafana:
    image: grafana/grafana
    depends_on:
      - prometheus
    ports:
      - 3000:3000
    volumes:
      - grafana_data:/var/lib/grafana
      - ./grafana/provisioning/:/etc/grafana/provisioning/
      - ./grafana/:/etc/grafana/
    env_file:
      - ./grafana/config.monitoring
    networks:
      - monitor-net
    user: "472"
    deploy:
      placement:
        constraints:
          - node.role==manager
      restart_policy:
        condition: any
其中kafka_exporter与webhook-dingding 是可选服务,这里主要是用于kafka集群的监控与告警使用。启动命令: docker stack deploy prom --compose-file=docker-stack.yml
配置
prometheus 配置文件(prometheus.yml)
# my global config
global:
  scrape_interval:     15s # By default, scrape targets every 15 seconds.
  evaluation_interval: 15s # By default, scrape targets every 15 seconds.
  # scrape_timeout is set to the global default (10s).

  # Attach these labels to any time series or alerts when communicating with
  # external systems (federation, remote storage, Alertmanager).
  external_labels:
      monitor: '监控系统'

# Load and evaluate rules in this file every 'evaluation_interval' seconds.
rule_files:
  - 'alert.rules'
  # - "first.rules"
  # - "second.rules"

# alert
alerting:
  alertmanagers:
  - scheme: http
    static_configs:
    - targets:
      - "alertmanager:9093"

# A scrape configuration containing exactly one endpoint to scrape:
# Here it's Prometheus itself.
scrape_configs:
  # The job name is added as a label `job=<job_name>` to any timeseries scraped from this config.

  - job_name: 'prometheus'

    # Override the global default and scrape targets from this job every 5 seconds.
    scrape_interval: 5s

    static_configs:
         - targets: ['172.31.0.144:9090']

  - job_name: 'kafka-exporter'

    # Override the global default and scrape targets from this job every 5 seconds.
    scrape_interval: 5s
    static_configs:
         - targets: ['172.31.0.144:9308']

  - job_name: 'cadvisor'

    # Override the global default and scrape targets from this job every 5 seconds.
    scrape_interval: 5s

    dns_sd_configs:
    - names:
      - 'tasks.cadvisor'
      type: 'A'
      port: 8080

#     static_configs:
#          - targets: ['cadvisor:8080']

  - job_name: 'node-exporter'

    # Override the global default and scrape targets from this job every 5 seconds.
    scrape_interval: 5s
    static_configs:
         - targets: ['172.31.0.144:9100','172.31.0.136:9099','172.31.0.117:9099','172.31.0.118:9099']
这里主要配置一些exporter服务,主要用来提供数据,用于分析监控。
prometheus 配置文件(alter.rules)
groups:
- name: 服务告警
  rules:

  - alert: 服务异常关闭
    expr: up == 0
    for: 1m
    labels:
      severity: prometheus
    annotations:
      summary: "prometheus实例关闭"
      description: "{{ $labels.instance }} of job {{ $labels.job }} 已经关闭了!!!!"

  - alert: 消息积压
    expr: kafka_consumergroup_lag > 30
    for: 1m
    labels:
      severity: kafka
    annotations:
      summary: "kafka消息积压"
      description: "kafka 消费组 {{ $labels.consumergroup }} \n\r topic: {{ $labels.topic }} \n\r 消息积压数: {{ $value }}"

  - alert: CPU告警
    expr: (1 - avg(irate(node_cpu_seconds_total{mode="idle"}[5m])) by (instance)) * 100 > 90
    for: 1m
    labels:
      team: node
    annotations:
      summary: "CPU告警"
      description: "机器(ip = {{$labels.instance}}) \n\r CPU使用量超过90%,目前剩余量为:{{ $value }}"

  - alert: 磁盘告警
    expr: 100.0 - 100 * ((node_filesystem_avail_bytes{mountpoint=~"/", device!="rootfs"} / 1000 / 1000 ) / (node_filesystem_size_bytes{mountpoint=~"/", device!="rootfs"} / 1024 / 1024)) > 85
    for: 1m
    labels:
      team: node
    annotations:
      summary: "磁盘告警"
      description: "机器(ip = {{$labels.instance}}) \n\r 磁盘使用量超过85%,目前剩余量为:{{ $value }}G "

  - alert: 内存告警
    expr: (node_memory_MemTotal_bytes - (node_memory_MemFree_bytes+node_memory_Buffers_bytes+node_memory_Cached_bytes)) / node_memory_MemTotal_bytes * 100 > 90
    for: 1m
    labels:
      team: node
    annotations:
      summary: "内存告警"
      description: "机器(ip = {{$labels.instance}}) \n\r 内存使用量超过90%,目前剩余量为:{{ $value }}M "
以上是自定义的各种告警指标。
alertmanager配置文件(config.yml)
 route:
     receiver: 'web.hook'
 receivers:
  - name: 'web.hook'
    webhook_configs:
      - url: http://172.31.0.144:8060/dingtalk/webhook1/send
这里将会将告警信息发送到指定告警api,可自定义webhook服务,处理告警消息内容。
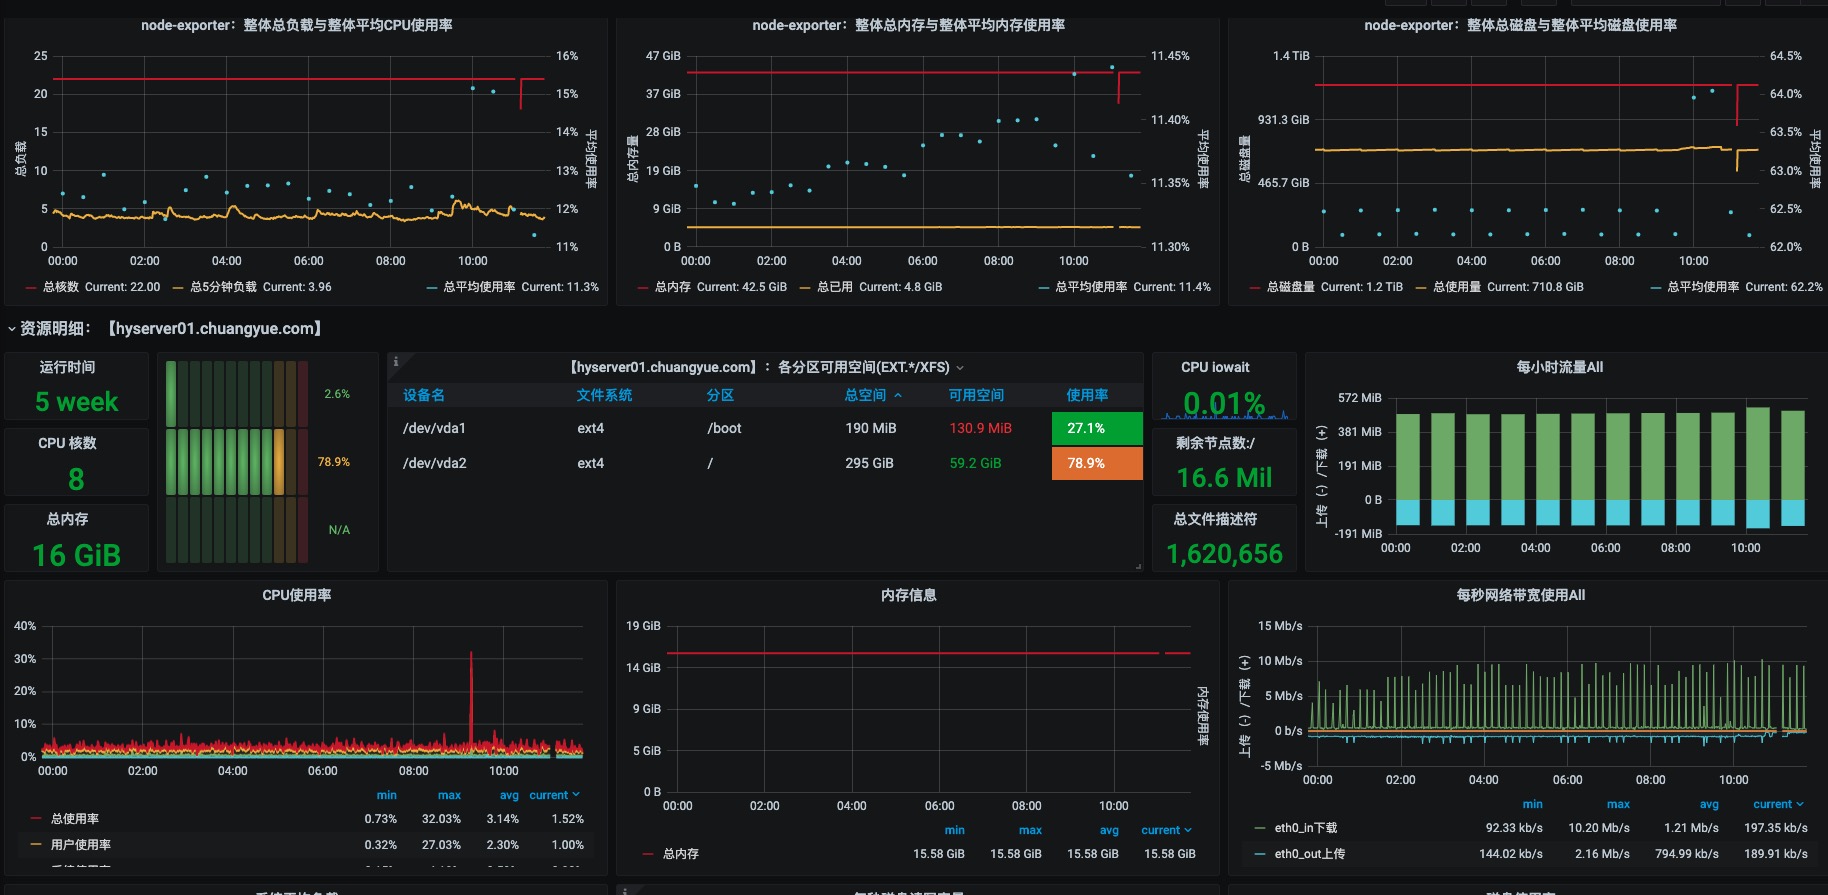
效果图


请到客户端“主题--自定义配置--配置”中填入leancloud_appID和key